As promised in the previous post here is a sneak peak of the new NetKernel Enterprise Edition Visualizer tools. These tools do not make any new information available as the core visualizer shows every gory detail. However these new views perform in-depth analysis of the low-level data to determine information that can be quite labour intensive to infer when working with large request trees.
These new views are:
- an expiry determinants tool to allow rapid determination of why any particular response is expired.
- a scope determinants tool to find which sub-requests are de-scoping into the request scope during resolution.
- a compare caching tool which finds differences in two requests that are stopping them being cached.
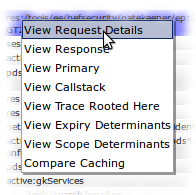
These tools appear as new items in the context menu of every captured request in the visualizer.
Expiry Determinants Tool
When the response from an endpoint is marked as expired it is often difficult to determine why if that expiration has occurred if you have deep sub-request tree. Expiration propagates up to all dependent resources by default and one expiring request deep down can cause a whole sub-tree to fail to cache. WIthout this tool you must manually search down through the tree of requests until you find the cause.
Using the tool you simply select a captured request in a trace and select “View Expiry Determinants” and you will get a filtered tree view of the sub-requests with requests that are cause of expiration highlighted in red. All irrelevant branches of the tree (that are not expired) are trimmed.
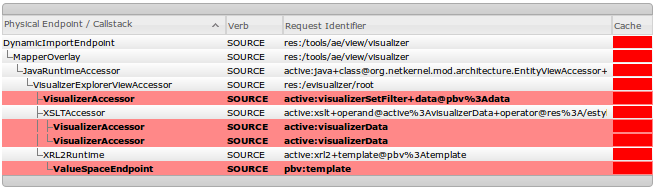
Scope Determinants Tool
A feature of the refreshed visualizer is a cachability status indicator (traffic light). Red means no caching is possible, amber mean cache retrieval is constrained by request scope and green means caching is possible. When a response has amber cachability status this is an indication that the response depends upon the context that the request was issued. This causes a non-zero response scope depth. What this means is that the request itself or one of it’s subrequests has de-scoped to resolve a resource. Using this tool you can rapidly see which request(s) this is. Select a captured request in a trace and select “View Scope Determinants”. You will get a filtered tree view of sub-requests with requests whose resolution is descoping above the selected requests scope are highlighted in yellow. Also depth indicator on the right showing how deep they resolve. All irrelevant branches of the tree (that don’t de-scope or contain de-scoping requests) are trimmed.
In this screenshot you can see that resolution of pdsConfig.xml resource required three spaces from the request scope but the major culprit is the XMLToHDS transreptor which de-scoped all the way back to the “Control Panel (private)” space. Armed with this information it might make sense to import the xml core module which supplies this transreptor into “NKEE / Tools”.
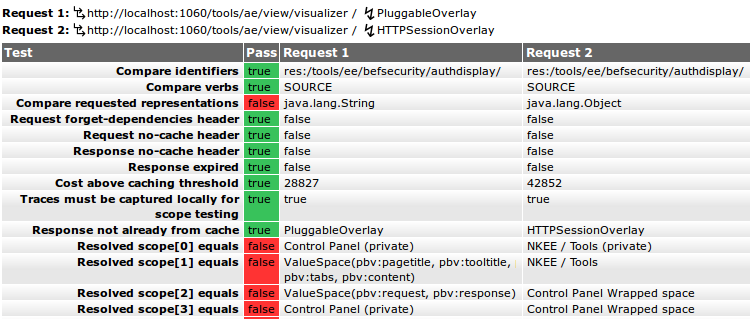
Compare Caching Tool
If you have a resource that is being used within a request that isn’t being retrieved from cache but you expect it to be this tool will help. You need to capture two separate requests for the resource and then sequentially select them in the visualizer and select “Compare Caching”. This tool will step through all the possible causes for non-retrieval.