For a bit of fun I put together a low budget home monitoring system using an old PC, a few wires, sensors and 1060 NetKernel.
The aim was to create a system to remotely monitor my home and its ambient weather conditions. I also wanted the data to be stored so that historical graphs could be generated.
The Hardware
The host PC was an old Gateway Solo Laptop with a Pentium 166MHz MMX, 64MB RAM running Win98SE with a USB network adaptor and with an in-built joystick port.
The standard PC joystick port provides 4 analogue inputs and 4 digital inputs. Each analogue input must provide a resistance varying from 0 Ohms to 150 kOhms and each digital input must be provided with 0 or +5V.
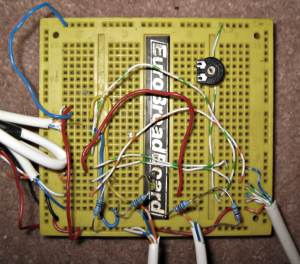
Figure1: patched connections between joystick port and sensors (not pretty)
I connected the sensors as follows:
- analogue1 - outdoor temperature using a 100kOhm negative temperature coefficient thermistor mounted under the eaves of the house
- analogue2 - indoor temperature (same thermistor model) mounted in a downstairs room.
- analogue3 - daylight using a Cadmium Sulphide cell
- analogue4 - rainfall using a simple copper circuit stripboard with alternate strips linked and then mounted onto the roof to detect a lowered resistance when rain is falling.
- digita1 - outer front door using a magnetic reed switch
- digital2 - inner front door using a magnetic reed switch
- digital3 - movement in hallway using a 5V PIR sensor, it provides a 1.5 second pulse when activated
- digital4 - not used.
Software
The software was developed on NetKernel as a collection of services written as Beanshell scripts (www.beanshell.org scripted Java) and styled with XSLT. NetKernel ran on a JDK 1.4.2 Java Virtual Machine which was configured with 32Mb heap.
Architecture
The system was packaged as a NetKernel module which hosted two transports:
A custom written Cron transport to issue requests at timed intervals A HTTP transport to serve HTML pages and PNG graphs
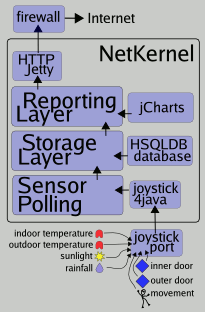
Figure 2: home monitor architecture
Joystick Port
The Joystick port is read by a NetKernel accessor which reads the state of joysticks 1 and 2 (i.e. the 4 analogue and digital inputs) and presents the result as an XML document. The accessor uses the Joystick for Java library (http://www.cybergarage.org/vr/device/joystick/java/) Each analogue sensor returned a value between -1 and +1, and the digital sensors return true/false. The joystick data has the following structure…
<gameport>
  <a>-0.606708</a>
  <b>0.100619525</b>
  <c>-0.66768396</c>
  <d>1.0</d>
  <e>true</e>
  <f>true</f>
  <g>false</g>
  <h>true</h>
</gameport>
Signal processing
A signal processing job is run every second and is initiated by the Cron transport. It performs the following tasks:
Smooth the analogue inputs. Each input is quite noisy so it is smoothed with a low-pass digital filter producing a clean output which is higher resolution (due to dithering) than the sampled signal. Detect edges on the digital inputs. These are then timestamped. The signal processing job produces an XML document:
<gameport>
  <a>-0.5899696</a>
  <b>0.32962057</b>
  <c>-0.6616194</c>
  <d>1.0</d>
  <e>
    <last-true>1101286756550</last-true>
    <last-false>1101286752590</last-false>
    true
  </e>
  <f>
    <last-true>1101284488670</last-true>
    <last-false>1101284292810</last-false>
    true
  </f>
  <g>
    <last-true/>
    <last-false>1101239403960</last-false>
    false
  </g>
  <h>
    <last-true>1101284474340</last-true>
    <last-false>1101284466370</last-false>
    true
  </h>
  <timestamp>1101312322110</timestamp>
</gameport>
Storage Layer
A storage service is invoked every 5 minutes. This performs the following tasks:
Transforms the raw analogue values into calibrated values - degrees centigrade for temperature and percentages for light and rain. Determine if the house is occupied or not based on the edge timestamps on the digital sensors. (If the outdoor was closed after the inner and there has been no internal activity detected for a while then the house must be unoccupied) Store the values in a HSQLDB (http://hsqldb.sourceforge.net/) database
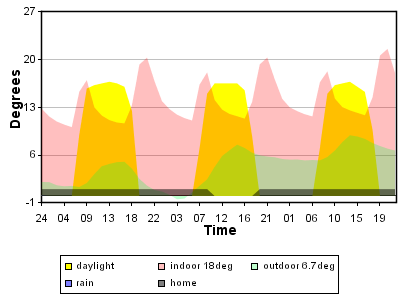
Figure 3: Live home monitor data
Reporting Layer
I created a parameterised service which would generate a historical PNG graph for a certain period into the past. It takes three parameters: period of graph, number of samples to merge (to keep the graph from containing too many data points) and format of timestamp labels.
The service is implemented as a pipeline: a database query retrieves a result set as XML, a beanshell script merges the points, an XSLT stylesheet styles the data into a chart document to feed into the NetKernel chart generating accessor which uses JCharts (http://jcharts.krysalis.org/).
The service is exposed on the public interface of the module and thereby out on the HTTP transport. The XRL mapper is used to present various preset service interfaces at the URI locations /6hour /day /3day. The image shown above and these links are realtime reports generated by the home monitoring server and locally cached on 1060.org. The home being monitored is in a secret Wiltshire location!
Issues
Calibration of the analogue sensors has been an ongoing source of problems, particularly the temperature sensors. Although the joystick port appears to be linear with input resistance, there is crosstalk between the sensors - a low resistance on one line pulls down the values on others. I have tried to algorithmically compensate for this but not too successfully.