We are getting close the first anniversary of the NetKernel 4. With the release of Netkernel 4 finally we had the solid core ROC abstraction that we had always talked about. Along with the core abstraction came a metadata model which we haven’t really talked a lot about. Metadata means a lot of different things to different people so just to be clear, what I’m talking about here is the system state that is generated and captured by the core NetKernel infrastructure of the kernel in combination with standard modules. This includes the data on the deployed functionality and it’s structure as well as runtime data about requests, who issues and receives them. It has had some use in tools like the visualizer and space explorer but really these tools are complex and overwhelming to most people because not a lot of work has gone into really making them usable- they are power tools that show err on the side of showing all the information available.
Why did we bother?
Over the last year I’ve spent quite a bit of time thinking and working to make NetKernel easier - trying to tame the abstraction. One thing I’ve come to realize is that it’s all well and good making great things possible but it is much harder to make them easy. Unifying the concepts of ROC into a cohesive whole was a big investment in intellectual energy in years past and that provides us with a sound basis but leaves much work to do in the areas of modeling, patterns, conventions and tooling.
We’ve known for a long time about the componentized basis of ROC enables the Construct Compose Constrain development methodology that leads to the big reductions in system complexity and code. I’ve always had the vision that this was amenable to a visual development approach in the same way that dataflow languages are in tools like Labview. This is where we are heading - a full visual development environment backed by the ROC abstraction.
Anyway to cut a long story short we released a ROC Architecture Explorer Preview which sparked of some interest a couple of weeks ago. The roadmap for this tool is that it will replace the space explorer and provide a pluggable tool for exploring the interrelationships of the metadata model. One of the initial views included is what we are calling a Static Structure Diagram this has a lot in common with the static diagrams of UML.
The Static Structure Diagram shows, primarily, Spaces with their set of Endpoints and the request delegation relationships between those spaces. It can also show the physical packaging of those spaces within their hosting modules. This diagram provides a great way to understand the architecture of the system.
Here is a diagram of the NetKernel CRON module:
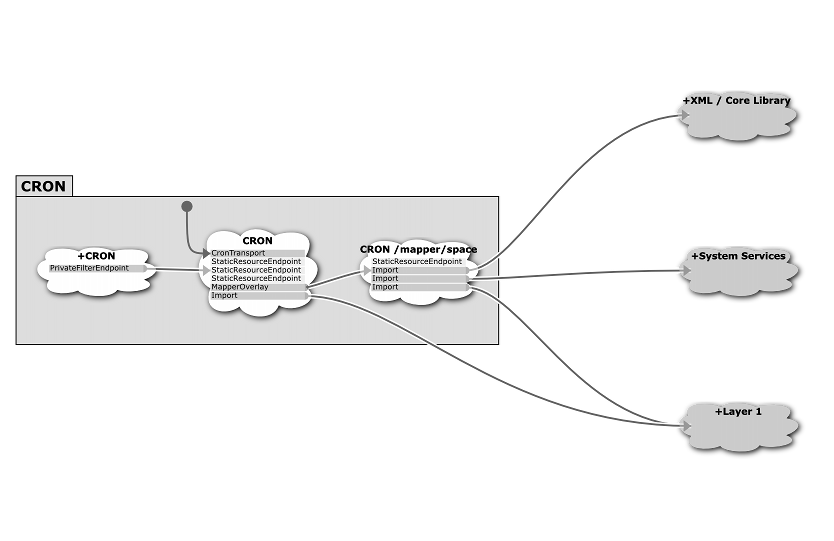 Fig 1: Static Structure Diagram of Cron module
I’ll describe this diagram now and doing so show how a picture paints a thousand words! From this diagram we can see that the CRON module consists of three spaces. The leftmost space is the only public space (meaning it can be imported by other modules), this is signified by the + character at the beginning of it’s title (just like UML). The second space is delegated to by the first through the PrivateFilterEndpoint, this provides the encapsulation by hiding all the resources marked as private in the second space. This second space contains six endpoints, the first is a transport which receives external events. We can see this by the line started with a circle and leading into the transport. In this case the CRON transport is the endpoint which receives the triggered actions from the underlying CRON engine and issues the requests. The space also consists of a number of StaticResourceEndpoints which map files in the module structure into the address space, then a mapper which delegates requests into the third space and finally an import of the Layer1 module. The third space will only receive mapped requests delegated from the second and it fulfills those requests through a another StaticResourceEndpoint and some imports of other modules.
Ok now you know the notation see if these make sense. Here are two variants of the the Static Structure Diagram for the Frontend fulcrum on my development machine show both Wink and PhotoNK applications dynamically imported as well as a few other odds and ends. The first diagram omits the module boundaries and the second shows them, both diagrams hide the detail of imported libraries.
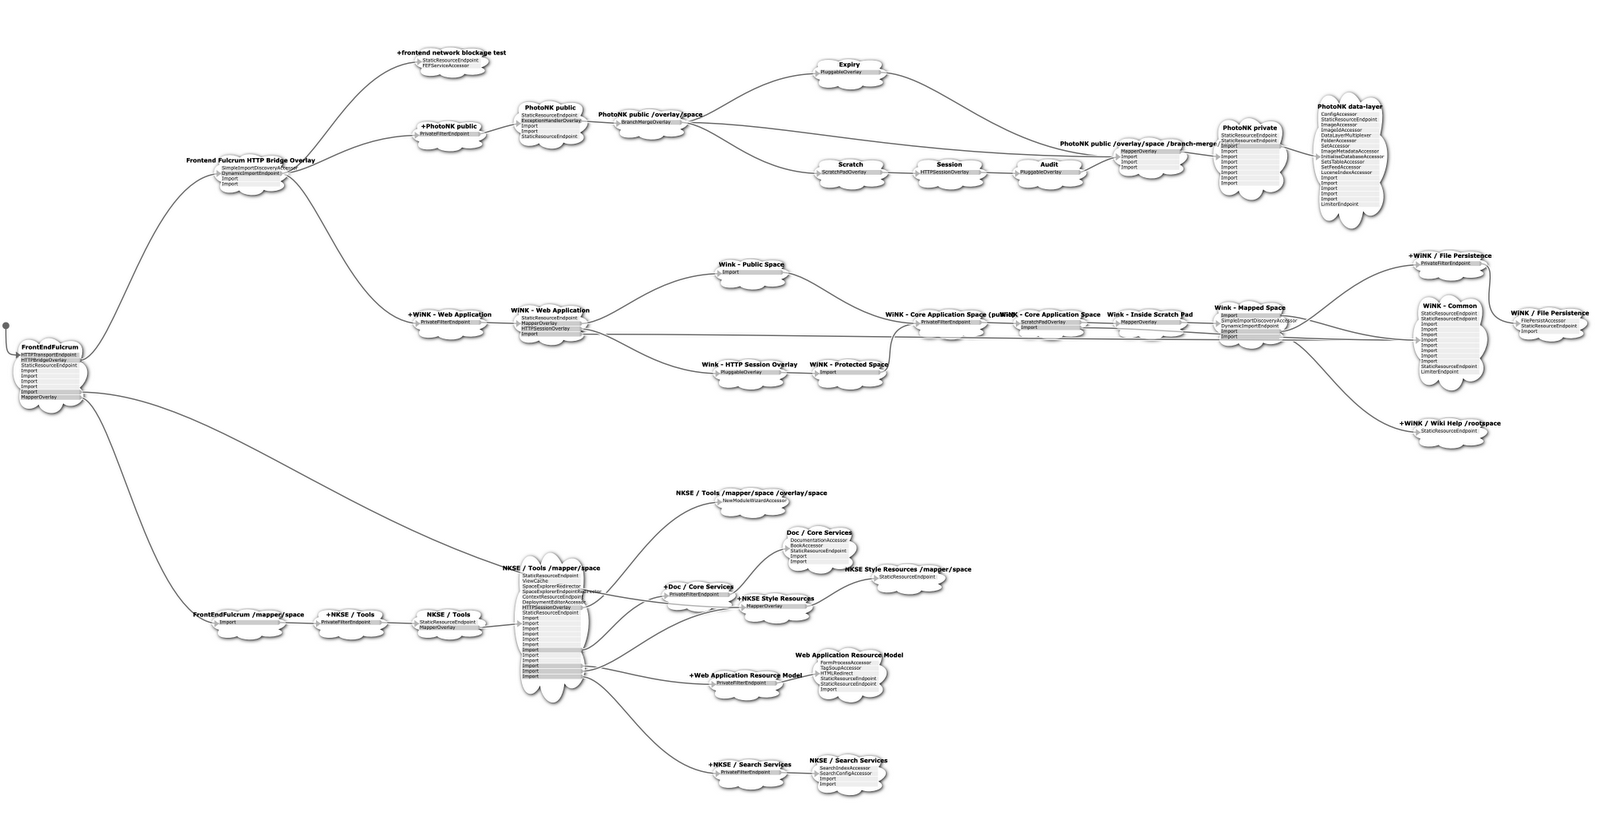 Figure 2: Frontend Fulcrum hiding module boundaries
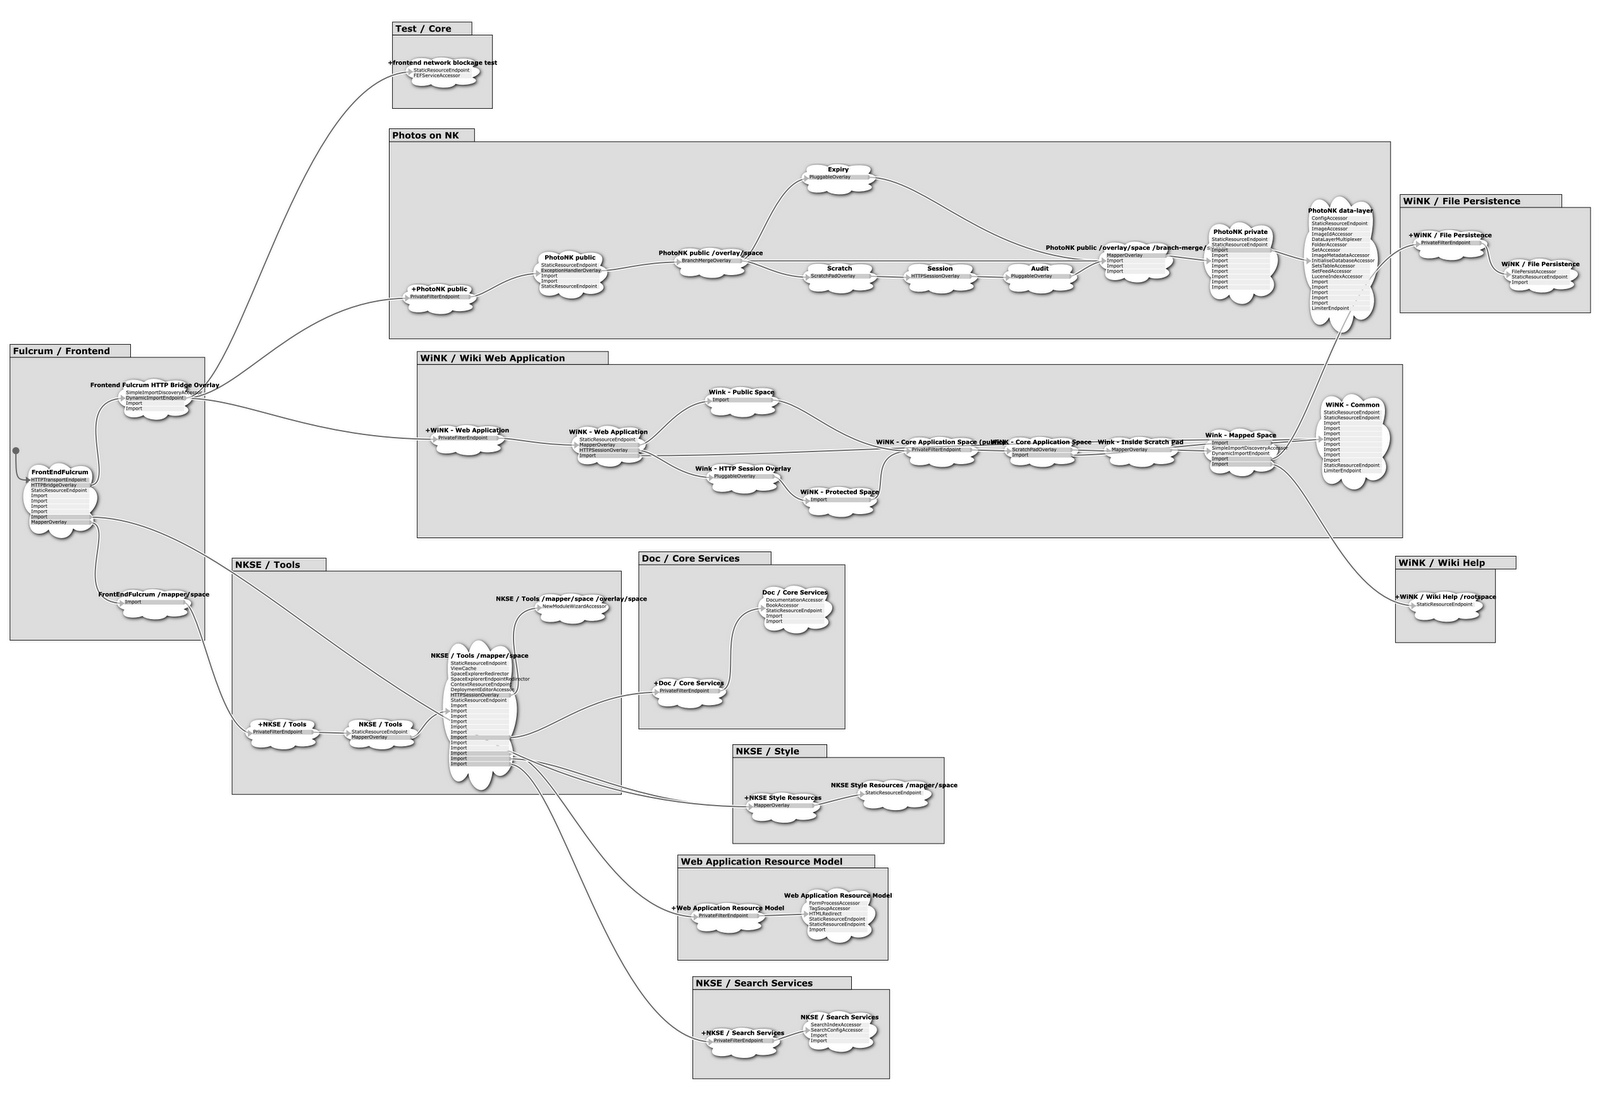 Figure 3: Frontend Fulcrum showing module boundaries
One objective of the Static Structure Diagram is that is can be both human drawn and machine generated. Internally the tool generates SVG’s so there should be good for printing big! I’ll love to hear any feedback about this diagram and how it can be improved.
Cheers, Tony