I’m writing this post to document information that I learned whilst developing the new NetKernel enterprise L1 representation cache (released today!). Knowledge of how to tune large Java instances is readily available but because NetKernel uses a cache as an integral part of it’s operation and usually this takes up a significant majority of the heap space of a running system this effects the conventional wisdom. So this article summarizes and augments this information with tips and details for tuning large NetKernel instances. This is a quite complex topic as Java GC itself is quite complex and necessarily this post only scratches the surface with information that I have found useful.
In this discussion we are talking purely about tuning heap usage and garbage collection. How we tune this will effect system latency (average/maximum pauses) and throughput. There are many other dimensions to tuning applications which effect performance and should be considered in addition to tuning heap, these include:
- choice of deployment platform, JVM version
- scaling out across multiple instances
- memory leaks (although these relate to heap usage I consider these bugs rather than in need of tuning)
- application concurrency bottlenecks
- application CPU usage
- application I/O constraints
- algorithmic design
- data type choices
- optimizing cacheability
Prerequisites
Test load scenarios
It’s important to know what kinds of situations your application will need to deal with.
This doesn’t need to be exhaustive but it’s good to have a few scenarios that can easily be simulated. As we are just tuning heap here we are not concerned about creating a whole accurate architecture that may be needed for full web performance testing. However sometimes it may make sense to combine that testing, in which case you’ll need quite a sophisticated setup and the barrier to an individual developer/you running the tests are higher. I’ll leave that tradeoff to the reader!
I personally developed what I call a synthetic workload module which is a configurable application and clients. I have used this extensively to test the new cache and general NetKernel performance. It creates a variable structure with differing levels of data set size both in terms of count, representation size and request distribution. It tests overlays, endpoints, synchronous and asynchronous requests. I can then vary parameters overtime and capture various system statistics such as heap usage, CPU load, response time etc to plot graphs that can be observed in realtime as the test proceeds. I have promised to make this available in the 1060 repositories once I get documentation for it. However this won’t help you, at least as is, test your applications!
NetKernel built-in tools
NetKernel has a number of built in tools which can help you understand what is happening:
Status Tab - on this page you can watch CPU usage, heap usage, request rate and cache size all on one page in lockstep.
Representation Cache Tool - the new cache has a control panel tool which shows a great amount of detail about what is caching and when culling is initiated
GC Viewer
GC Viewer is a powerful tool for visualizing the operation of the Java GC process. The latest version is available here: https://github.com/chewiebug/GCViewer
To use GC Viewer you must add JVM flags to output details of realtime GC information to a file:
-Xloggc:[directory]/netkernel.gc -XX:+PrintGCDetails -XX:+PrintGCDateStampsGC Viewer can then “tail -f” (for non Unix readers I mean follow the data written to the file in realtime) to create a dynamic chart of what is happening.
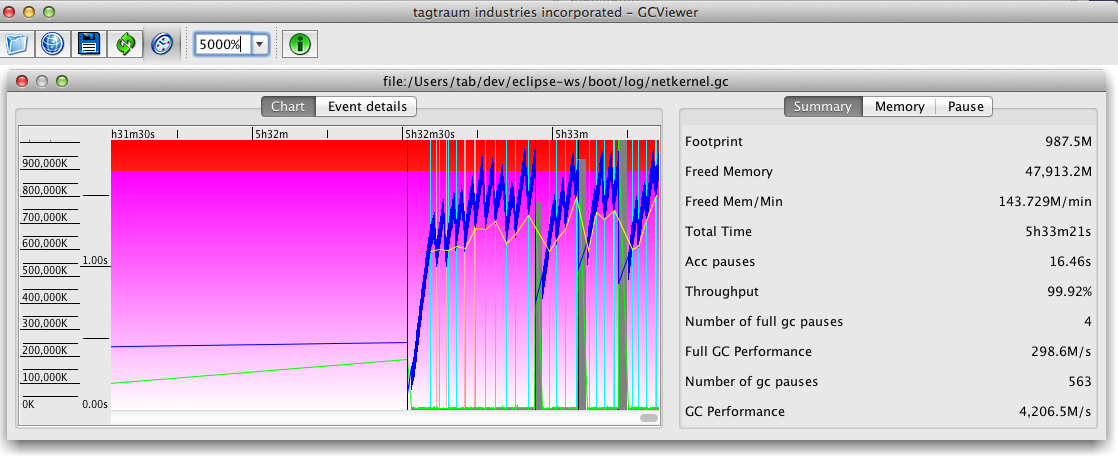 Figure 1: Using GC Viewer to see heap and GC profile
General principles
There is always a tradeoff between latency and throughput. As heap sizes grow this tradeoff becomes more distinct - if you want to continually and incrementally look for garbage you can achieve less GC pauses but the overhead of garbage collection will be higher. Java GC is quite an involved mechanism that generally works pretty well out of the box if your requirements are simple. Current implementations consist of a three tier approach. Eden where all new objects are created, survivor where all objects that are still relevant when Eden is full are moved too. Survivor space is used as a buffer before transferring objects into the OldGen space. When tuning heap I’ve so far not found it necessary to consider the survivor space.
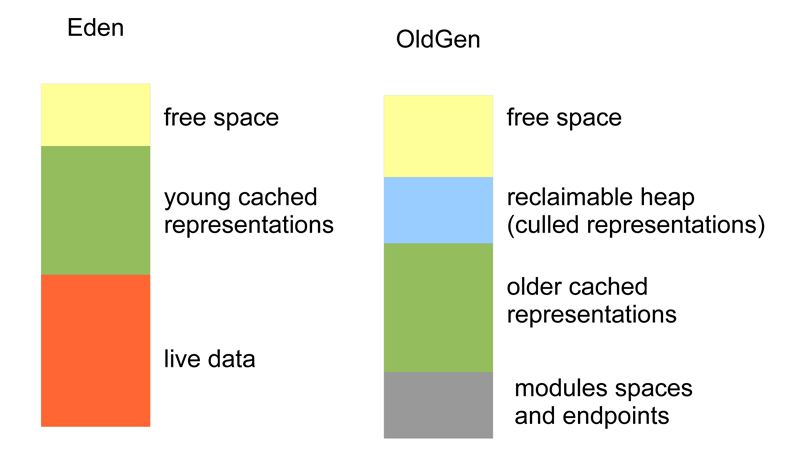 Figure 2: Breakdown of Heap
The Eden space is filled mostly with “live data”, this is the term given to transient objects that are created whilst processing occurs. In addition it will contain young representations that have yet to migrate into OldGen. Usually we do not need to concern ourselves too much with Eden. There is just one consideration that we will talk about later, that it must be large enough to hold the live data with enough left over for young representations to be migrated in an efficient way.
The OldGen space will have a relatively static proportion that is filled with all the module, space, endpoint classes as well as their internal state and kernel data structures. The largest proportion of the OldGen space is typically taken up by long lived representations that are held in the representation cache. In addition there will usually be an amount of space taken up by representations culled from the cache but still to be garbage collected.
To understand the lifecycle of OldGen consider the following diagram:
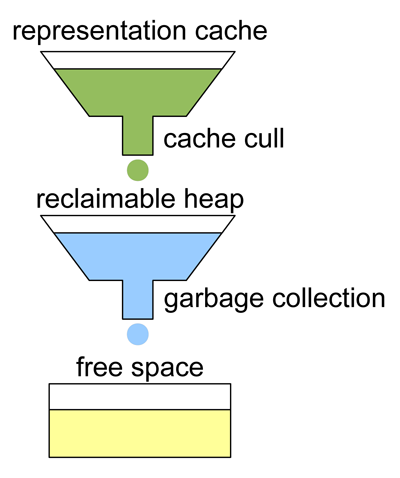 Figure 3: Lifecycle of OldGen
We represent the dynamic part of OldGen as a set of three receptacles. Representations find themselves in cache until they are culled. When the cull completes a set of representations migrate to become reclaimable. After this time when a GC occurs these representations can then be released an their space made free.
The implication of this two stage process at the end of life of representations is that it can take some non trivial amount of time for heap space to be freed up. As heap size increases and both cull and gc processes take longer and even overlap this time must be given serious consideration.
The following diagram plots OldGen usage overtime in a simple scenario of a cache cull followed by a GC. You can see the duration of time from the cull being initiated to heap actually being freed:
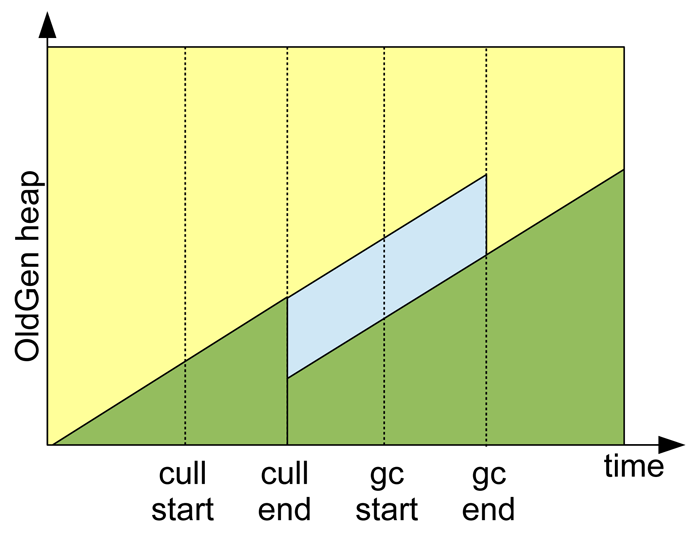 Figure 4: Heap breakdown over time
Saving the Best for Last
So far I have not talked about any of the specifics of tuning the heap such as what data to capture and which knobs to tweak. This post is turning out to be much longer than I anticipated so I think I’ll leave these details for a follow-on post.
In the meantime, if I’ve whetted your appetite for this very technical but fascinating subject then you can do get some more essential detail in these places:
Java Performance - Charlie Hunt / Binu John
http://www.amazon.com/Java-Performance-Charlie-Hunt/dp/0137142528
Java SE 6 HotSpot[tm] Virtual Machine Garbage Collection Tuning
http://www.oracle.com/technetwork/java/javase/gc-tuning-6-140523.html