This project promises to give you super-human powers. I still find it amazing that our eyes construct all the colours for the most part1 from the mix of red, green and blue that the cones in our eyes can detect. Despite this simple three valued approach to colour that pervades our eyes, cameras, monitors and computer graphics there is a deeper reality to colour in everyday life. This projects opens the door on that reality.
Background
The complexity with colour arises from the fact that visible light is actually a continuous range of frequencies from 400nm to 700nm wavelength. Different light sources emit these frequencies in different proportions. Different materials absorb and reflect these frequencies differently. Lastly our eyes absorb and detect the different frequencies with varying sensitivity.
To complicate matters further our eyes, or more correctly our visual cortex, adapt to different lighting so as to determine the correct colour of an object even when the light is not “white”. This adaption works well for natural light sources that we have evolved with. Often these light sources emit light close to black body radiation. Modern light sources such as fluorescent and LED emit quite complex and unnatural spectra. These light sources interact with materials in complex ways that our eyes cannot deal with well.
CRI or colour rendition index is a metric to determine just how natural and close to black body radiation a light source is. Fluorescent and early LED lights do poorly on this index.
This problem was apparent to me for a while because of the gloomy light given out by my compact fluorescent bulbs. Even very bright bulbs subjectively gave this unquantifiable gloomy feel. When, in contrast, a beam of sunlight shoots through the window you can immediately feel it’s clarity and naturalness.
Last year I installed some RGB LED strips into my home aquarium. These came with a fancy controller which allowed fine control of the brightnesses of each channel. I was hoping for these to replace the specialist fluorescent tube which gives out a pinky light. It recreates a full range of natural light with accentuated reds and blues to aid photosynthesis and reduce the greenness caused by plants and algae. This replacement failed. Despite vivid reds, greens and blues emitted from these strips the combination again gave a gloomy light. Looking at the data sheets for the LEDs I also realised that the wavelengths emitted would not keep the plants growing either.
I needed to get a better grip on what was happening. The scientific instrument of an optical spectrometer was what I needed. Unfortunately commercial spectrometers cost upwards of £1000. I decided to see what it would take to make one.
Parts List
- Raspberry Pi, nothing fancy a Pi Zero will work. You will also need an SD card, power supply and maybe a WIFI dongle for this.
- Pi Camera - a NoIR version will allow spectrometry into the IR region too
- diffraction grating slide 1000 lines/mm. These are readily available on eBay.
- a light proof enclosure large enough to hold Pi with enough height to mount camera and grating - see below. I used cheap wooden hobby box.
- some black tape (to absorb stray light within enclosure.)
- blue tack or alternative to hold camera and grating in place.
Tools Needed
- junior hacksaw with blade able to cut enclosure.
- drill with 8mm drill bit
Construction Guide
This is pretty straightforward to build. It took me a bit of experimenting to get a few things right and make it work but now I can share that with you!
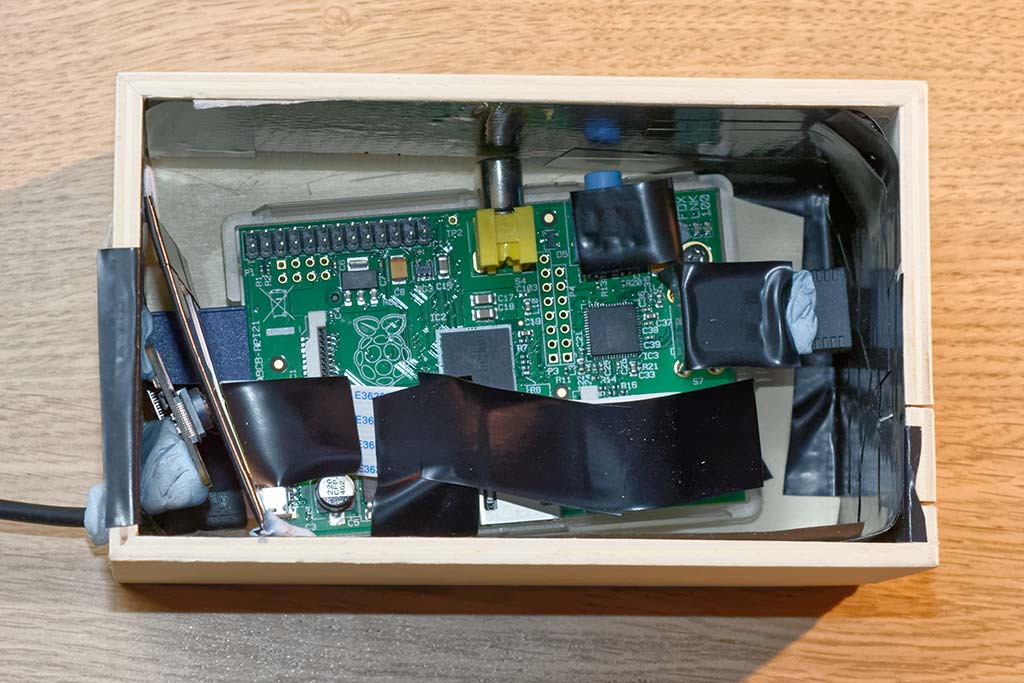 Figure1: Spectrogram Enclosure
- Setup Raspbian operating system on Pi. This has been tested on Raspbian Stretch.
- Enable WiFi and SSH so that we can remotely access it whilst sealed in enclosure.
- Take your Pi and attach the camera according to the standard instructions.
- Take your enclosure and position your Pi in the bottom. Position the camera vertically on wall of enclose using blue tack. Point the camera towards the opposite wall with an angle of approximately 30 degrees. This angle is not critical and you can adjust it later if necessary.
- Note and mark position of micro-usb power supply socket so that we can drill hole in enclosure to feed power in.
- Note position directly opposite centre point of camera lens so that we can saw slit in enclosure. See figure 2.
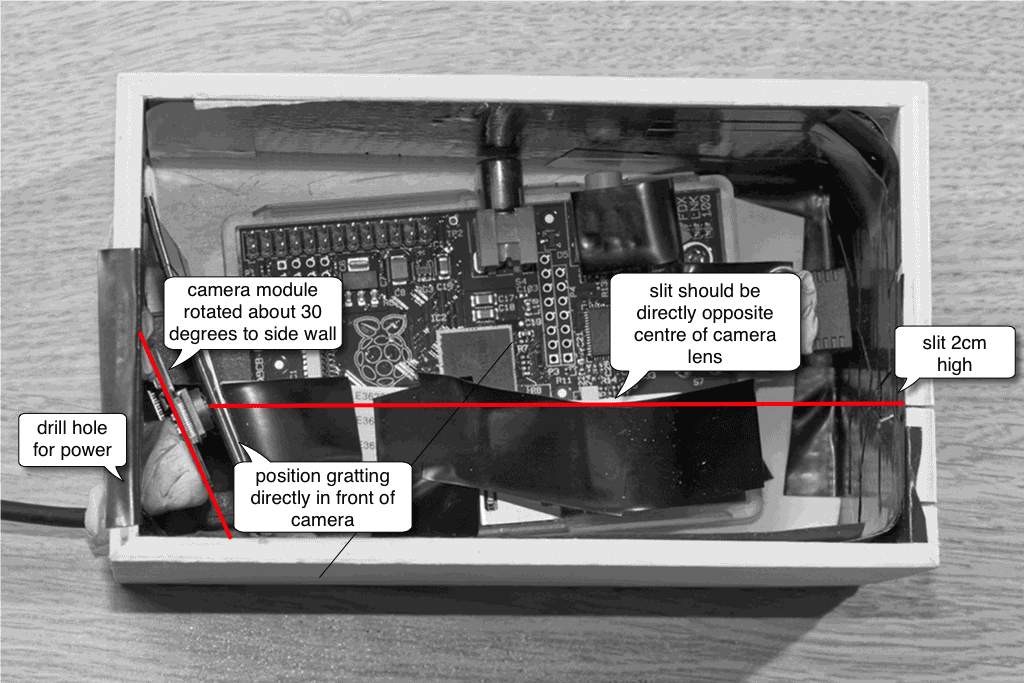 Figure2: Spectrogram Enclosure
 - Remove Pi and camera then drill hole for power and saw slit. Please be precise with saw cut - it must be straight and vertical. Any errors will effect resolution of spectrographs produced.
- Re-insert Pi and camera as previously installed and use raspistill to take a photo using the camera. We will need to then refocus the camera so that it focusses on the slit. (By default the camera focusses much further away than this.) Focussing the camera is quite delicate work but there are a number of guides on the web on how to do this.
- Line the inside of enclosure with black tape including all shiny parts of Pi. I also managed to put tape into the slit I cut to make it narrower (the narrower the better for resolution of the final spectrogram.)
- Put blue tack over any LEDs on Pi and WiFi dongle to block light.
- Fasten the diffraction grating in front of camera as close as possible to lens. The exact angle and position is not critical. See figure 3.
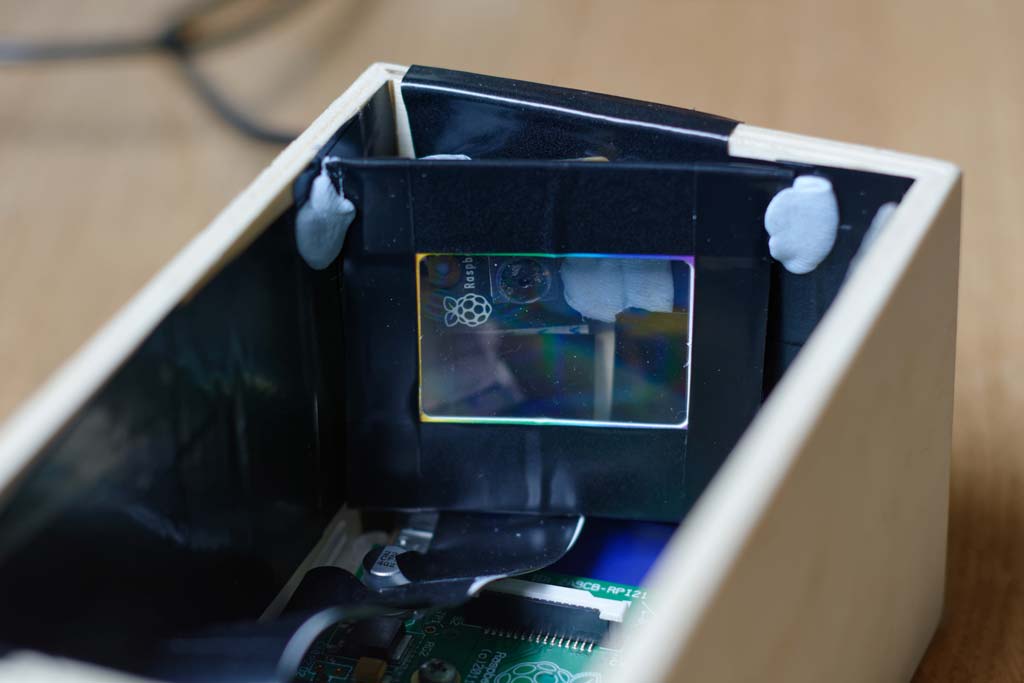 Figure3: Spectrogram Enclosure
 - Close the enclosure, place bright torch in front of slit and use raspistill again to take a photo. You should see a nice photo of slit and a spectrum off to one side similar to figure 4. You may need to adjust exposure of camera to get sufficiently bright image.
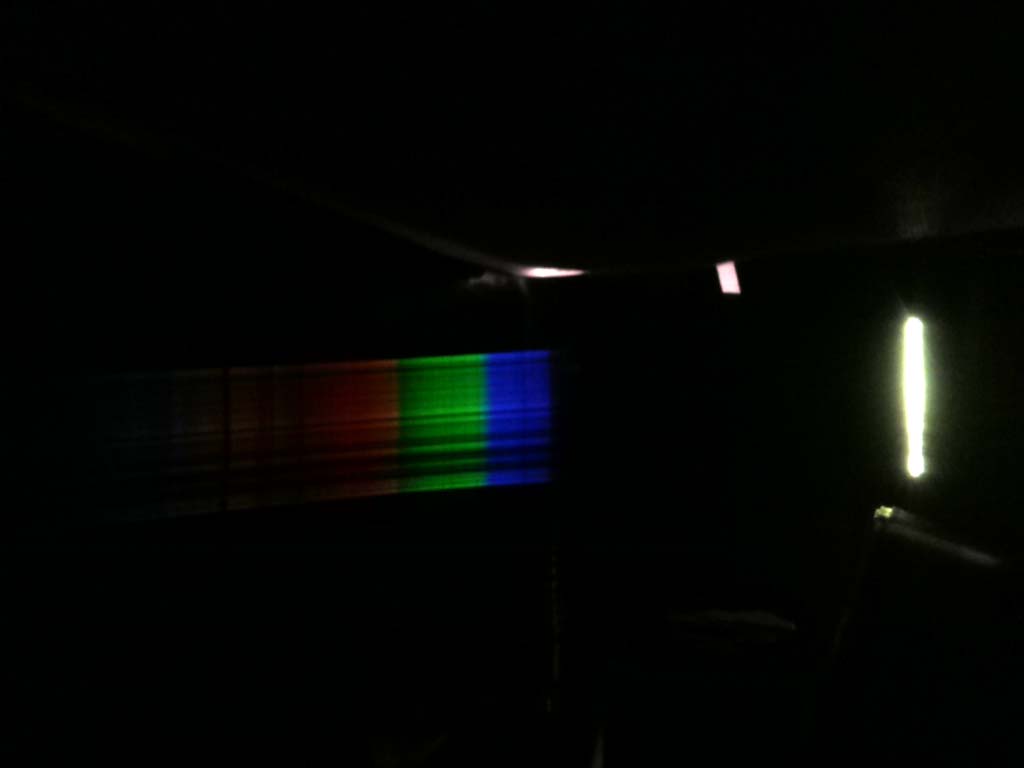 Figure4: Test image taken with raspistill
 - If slit is not visible or spectrum is cropped or not straight adjust positioning of camera and try again. (It is not critical that spectrum is dead straight as software has a parameter to adjust for this.)
- If any stray light inside the enclosure from either gaps or glowing LEDs on Pi you should see them now and rectify.
- That’s it. We are now ready to move to the software.
Code
The software needed is a single python script which I’ve put up onto GitHub.
Here are the steps to getting it working:
- Download .py file from github to empty directory.
- Install additional libraries:
sudo apt-get update
sudo apt-get install -y python3 python3-pip python3-pil libjpeg8 libjpeg8-dev libfreetype6 libfreetype6-dev zlib1g python3-picamera fonts-lato
Instructions for use
- Place light source in front of slit. If light source isn’t even, i.e. it has multiple different coloured parts such as RGB strips or LCD displays, then you’ll need to diffuse the light a little bit to get more accurate results. A piece of tracing paper or some bubble wrap will help.
- SSH into Pi, go to directory where the python file is and run:
The first argument is the filename prefix for the generated results. The second argument is the shutter time in microseconds. You will need to manually adjust this on a trial and error basis to get a decent exposure. You will see output such as:python3 spectrometer.py my_first_spectrograph 100000ideal exposure between 0.15 and 0.30 exposure= 0.0896399029893 consider increasing shutter time - Execution takes up to 10 seconds. Much of this time is time it takes for the camera module to warm up but also the python code has not been optimised.
- After execution you will see three files have been generated my_first_spectrograph_raw.jpg, my_first_spectrograph.jpg, my_first_spectrograph.csv and my_first_spectrograph_chart.png. The first image is straight from the camera. The second is the raw image overlaid with the analysis including the scan line from the slit to the spectrum. If the scan line doesn’t align with the image you can adjust the source code variable spectrumAngle. The CSV file contains the raw results with wavelength and amplitude columns.
- The last file ending _chart.png contains the result we are really after. This is the nicely formatted spectrograph. If you see a lot of noise or artefacts it’s probably because the exposure wasn’t correct.
- Best way to retrieve and view the files is with an sftp client.
Results
Here are some of the results I’ve got from this spectrometer:
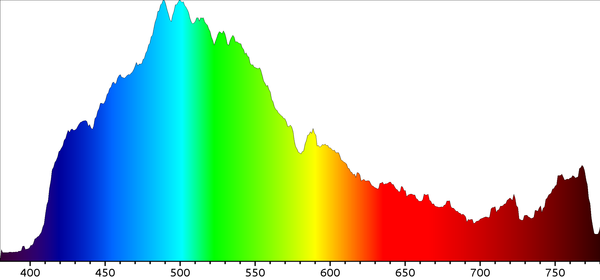 Figure5: Daylight spectrogram
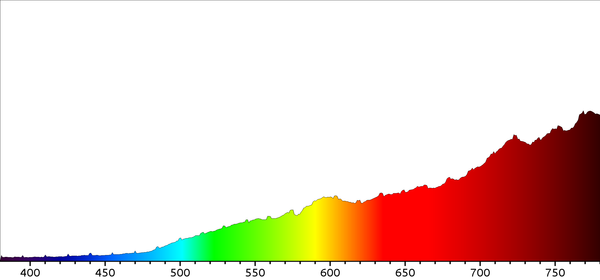 Figure6: Dimmed incandescent spectrogram
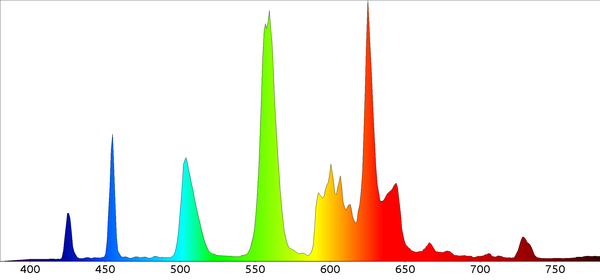 Figure7: Compact fluorescent spectrogram
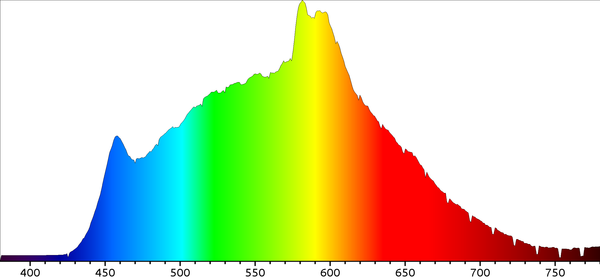 Figure8: Compton warm white LED spectrogram
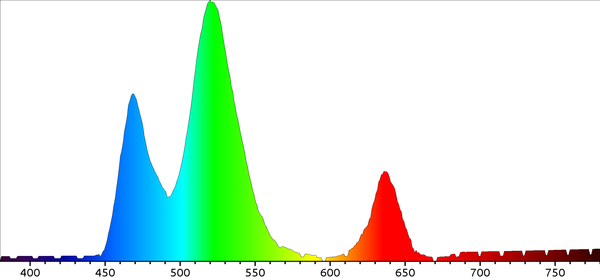 Figure9: RGB strip LED spectrogram
Calibration
The code on GitHub is calibrated for the 1000lines/mm grating which I used. I did try another grating which was supposed to be 500lines/mm. (You will see a commented out line in the source code for this.) However I recommend you calibrate the spectrometer yourself just to be sure. The best way to do this is with a low pressure sodium street light. It has a very strong primary spectrum line at 589nm. Adjust the scaling factor until the spectrogram correlates with this.
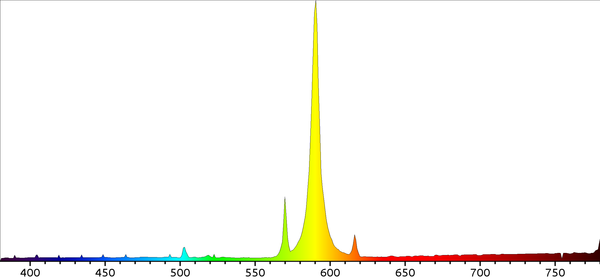 Figure10: Spectrogram of low pressure sodium lamp
Infrared
For some reason that I have not investigated this spectrogram does not capture light into ultra-violet. However it will capture infra-red light if you use a NoIR camera. In order to display a spectrogram covering this range edit the variable w2 with in the code.