In the last post I set the stage for a discussion on how to tune large NetKernel instances by providing a discussion of how the Java heap operates and how the NetKernel representation cache interacts with that. Now we are ready to get into the details of how to tune your system.
So let’s get stuck in. First we need to capture a of couple metrics:
- Fixed OldGen - this is composed of the long lived objects that are the modules, spaces, endpoints and kernel data structures. (OldGen is a common abbreviation of Old Generation)
- Live Data Size - this is composed of the transient objects that are created whilst processing occurs.
Determine Fixed Oldgen
Make sure you enable GCViewer or some other reliable mechanism for watching heap usage in realtime. Boot your system with the default NetKernel configuration or increased heap size if that is necessary. Run a typical load through the system for one minute or until you think things have been pretty much warmed up. Clear the representation cache. Then manually trigger a full garbage collection a couple of times. Observe the lowest total heap usage at this stage, this is the Fixed Oldgen.
Determine Live Data Size
If you haven’t done this already, you are going to need to determine what the desired concurrency of your system is. For a system without any slow I/O you’d typically want to keep the concurrency around the size of the number of CPU processing cores, not less but not too much higher. Having more concurrency will not increase throughput but will increase the live data size and increase thread switching overhead on the CPU. With I/O it get’s more complicated because you want to increase concurrency to keep the processor busy whilst other requests are waiting on I/O. You will want to enforce this maximum concurrency with a throttle. This will ensure that the system cannot become overloaded.
Boot your system again with your favourite tools for monitoring the heap. Then we need to choose a very small cache size - Here we are trying to get a balance of not letting the cache size effect the result whilst not letting the lack of a cache effect short term operation. (Often we rely on the cache to keep pre-compiled stylesheets and scripts etc.) Run through your test scenarios that are capable of fully loading the system up to maximum concurrency for a sustained burst. What we are looking for is the troughs in heap usage. These should occur immediately after a GC. Take a rough average of these troughs. This heap usage is the live data size plus fixed OldGen so subtract the fixed OldGen we calculated in the last section and we have our live data size.
The live data size is used to calculate the size of the Eden space in the heap. Typical recommendations are to choose a size between 1x and 1.5x the live data size.
How to determine remaining parameters
Oracle JVMs provide quite a range of different garbage collection strategies and exploring them in detail is outside the scope of this article. My experience is with using Concurrent Mark and Sweep (CMS) GC so this is what I’m going to talk about. CMS is the most consistently responsive GC strategy when the heap size grows because it performs nearly all it’s work concurrently with regular processing. There is a new G1 garbage collector - this is designed to be a better CMS for large heaps. I have no experience using it and it’s status is a little uncertain from what I can ascertain. For systems with small heaps or where best throughput is the priority there may also be better choices.
CMS imposes a higher overhead in terms of CPU usage and heap wastage than most other GC mechanisms - this is the tradeoff we make for consistent performance. It also has one very nasty characteristic - the stop-the-world (STW) collection. This occurs when it’s regular collection cycle cannot keep up with garbage created. When this happens all user threads stop until the STW collection completes. I have seen pauses of a couple of minutes on a 50Gb heap so it’s definitely to be avoided. Avoiding it however takes some careful tuning and being prepared to set aside a relatively large amount of heap for the worst case scenario. Even with enough headroom a STW collection can still occur if the heap gets sufficiently fragmented that there are no large enough gaps for new objects. Again this risk can be minimised but never completely eliminated by keeping the headroom large. This is an unfortunate limitation of most current Java implementations but there is at least one commercial JVM available which claims to address this issue. One other consequence of these STW collections is that the servers workload backs up putting additional pressure on other instances in a load balanced environment or just backing up in a queue elsewhere. What you really need to avoid, again not discussed here, is the domino effect.
CMS is enabled with the JVM flag:
-XX:+UseConcMarkSweepGCIn addition you’ll probably want to fix the dynamic nature of CMS. This because it doesn’t seem to interact well with the patterns of heap usage that occur with periodic large culls of the NetKernel cache. The following flags cause the GC to be initiated at fixed percent of heap being used. We will talk about tuning of the InitiatingOccupancyFraction in a moment:
-XX:CMSInitiatingOccupancyFraction=65 -XX:+UseCMSInitiatingOccupancyOnlyThe next step takes some iteration to find suitable values. If we have flexibility we can adjust total heap size within bounds of available RAM. Otherwise we’ll just be trying to optimize performance for the amount of available heap we have.
The parameters we are going to tune are:
1. Java Total Heap Size (if this is an option) - total maximum heap usage is set with the -Xmx JVM flag. This total will be broken into three parts, the Eden space which we just specified, a small (and usually insignificant Survivor space) and the remainder will be OldGen (usually the largest proportion of total heap)
2. Java CMS Initiating Occupancy Fraction - this is the trigger threshold, as a percentage of OldGen used, that initiates the concurrent GC process. We need to make this value low enough so that by the time it completes the remaining portion of OldGen will not have been completely filled. If we make it too low then the GC process will be triggered continuously and create additional processing overhead.
3. NetKernel Cache Heap Headroom - this is the trigger threshold, as a percentage of OldGen available, that initiates the NetKernel cull process. We need to make this value high enough such that it there is always at least enough heap space made available for the GC process to free. So this value must be greater than (100 - InitiatingOccupancyThreshold) The amount greater depends upon how slow the cull becomes.
4. NetKernel Cache Cull Percent - this is the percentage of cached items that will be culled per cull cycle. It doesn’t take more processing effort to cull more so making this value higher increases the efficiency of the cull process at the expense of granularity.
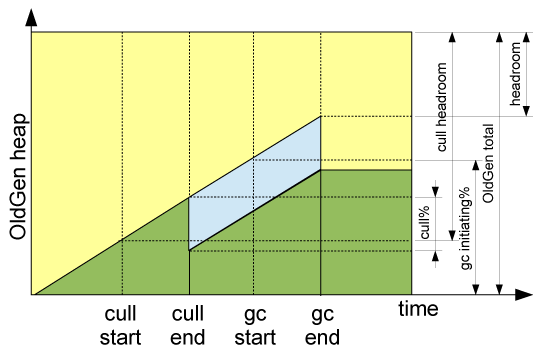 Figure1: Tuning parameters related to heap lifecycle
Putting these parameters onto the “heap breakdown over time” chart we saw last time we can see how the process can be controlled. The “headroom” measure on the top right is the free space that we are trying to avoid going down to zero. This chart is much simplified over what you’ll see in reality because the cache culls and the concurrent gc process will overlap. Also there are many minor GCs, something that we haven’t really talked about but that chip away at easy to access garbage in the very fine grained way. Another problem is that currently there is no way to see the cull process and the GC process together in one place in realtime. However given all these real world limitations what we need to do is to attempt now to maximise the cache storage capacity of the heap whilst ensuring we keep enough headroom to weather the perfect storm.
This storm will occur when our system is maxed out on CPU. The cache cull process and the GC will be running at their slowest. The GC will be running out of step with the cull so that we’ll miss GCing many of the representations first time around and they will sit around for longer than expected. Whilst all this is happening our real work will be happening at the maximum rate configured by our concurrency throttle but our users will be doing the most complex and intensive of requests possible all at the same time. This will be creating new representations to be cached and using the full amount of our live-data-size with transient objects during processing.

So to avoid panic we need to do our testing and play it safe. We are now reaching the final crunch point in this post and I guess your expecting a nice simple process to compute these tuning parameters I’ve given you. Let’s see what I can do knowing full well that there are too many variables and too few constraints.
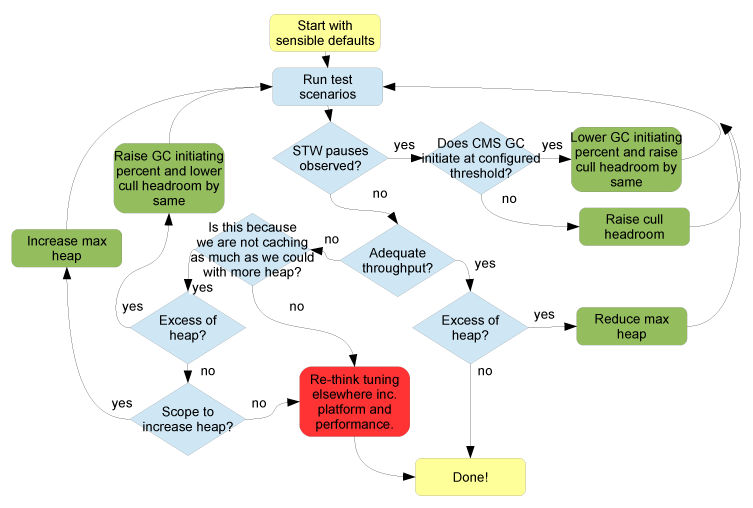 Figure 3: Tuning Flowchart
This flowchart is not perfect but it’s a good rule of thumb that should do you well. It doesn’t include tuning the cull% and there is one other omission that the observant reader will find but in pragmatic style it’s good enough.
Other Parameters
There are many other parameters that can be tuned in NetKernel but particularly the JVM. I would suggest keeping away from these unless you see specific problems or needs. These include:
- -Xms (starting heap size) I don’t bother to see this to anything other than the same as -Xmx (maximum heap size). This value may matter for lean startup of client side processes but on long runner servers it’s red herring.
- -Xss (stack space)
- -XX:MaxPermSize (permgen sizes)
In Conclusion
All this gets more complicated when you have mixed processing and different modes of operation with different computation and heap requirements that are done at different times. The general rule is: plan for the worst case.
Will caching actually help performance? Only cache what is useful as increased time performing GC on large OldGen will lower throughput. I.e. as large a heap as possible is not always the best plan.
I hope this article is useful but I am also aware that this is a complex topic that a couple of articles cannot do justice to. If you are serious about tuning NetKernel applications I believe you really need to read and understand the references. You can also see that we are balancing a lot of variables here and finding the right balance can be somewhat of an art and only experience will help you. Remember, also, that we, 1060 Research, are there to help with a great range of support options.
Java Performance - Charlie Hunt / Binu John
http://www.amazon.com/Java-Performance-Charlie-Hunt/dp/0137142528
Java SE 6 HotSpot[tm] Virtual Machine Garbage Collection Tuning
http://www.oracle.com/technetwork/java/javase/gc-tuning-6-140523.html