Last week we had a get together with representatives of some of our key partners in Brussels. There, amongst other things, I demonstrated a key new technology that I’ve been working on for the last couple of months. This is an all new enterprise grade representation cache.
The NetKernel representation cache is a mechanism for storing the responses from endpoints with the aim of eliminating duplicate computation. This is made possible because every computation is uniquely identified with a combination of resource identifier and request scope. Once responses are stored in the cache they remain retrievable until they are invalidated or they are culled. Invalidation of response can occur at any time through the use of an expiry function. These can be implemented in any number of ways; from never expiring, through to expiring after a period of time, to rich functions with callbacks into underlying implementation technologies. Culling of the cache occurs as a periodic activity removing a number of responses from the cache to keep it’s size within configured bounds. Responses are ranked based upon a number of factors including their cost to create and their usage profile; the least valuable are removed. For more details on operation of the cache see my previous post Caching: How and why it works.
We’d realized the requirement for a new cache when customers where starting to push beyond our expectations of both heap sizes and data sets sizes. Ready availability of servers with huge heaps has made this practical over the last year. Typical users of NetKernel run in heap sizes less than half a gigabyte and the existing enterprise cache performs well in this scenario all the way up to around 4Gb heap. Another trend we have seen is that of in-memory computing. In-memory computing, as the name suggests, involves all pertinent data being available in memory all at once rather than being paged from some kind of persistence store like a database. Working with large heaps and large representation caches is a way of realizing this approach.
Another identified limitation of the existing cache is that it doesn’t provide enough easily consumable information about what is being cached and how to enable efficient tuning of a system. To make matters worse when the cache size grew beyond 100K representations or so the response times in generating views of it became unacceptable.
So the new cache had to address these issues but I also had a few criteria of my own based on my experiences. I’ll mention these as I walk you through the new features:
Huge Heap Support
This cache is designed to work on heap sizes several orders of magnitude larger than the previous generation. It’s been tested on a 64Gb AWS instance running a 60Gb heap. With a test scenario generating various representations from 500b to 1Mb the cache was handling over 50M representations. This doesn’t effect put and get times and culls of 10% typically took less than 1 minute. The previous cache uses a synchronous GC at the end of a cull to determine available heap but this isn’t practical with large heaps because a GC takes over a minute and stops all other processing.
Safe Culling
If there are unexpected delays in culling either due to bad configuration (too small a cull%) or CPU load then the cull will remove more than the configured amount in order to keep the size within bounds. When the workload of the system changes rapidly it’s important that the cache can adapt quickly. For example, if you have some daily process that invalidates much of your cached state then new modes of operation my be initiated that require new resource distributions with differing representation sizes to be cached along with a higher workload. The new cache will rapidly adapt to such changes.
Efficiency Metric
In the previous cache the hit rate metric caused a lot of confusion. I often heard “how come I am only seeing 14% cache hits?” The trouble was the metric, whilst valid, was not intuitive and worse, not that useful, at least as an absolute value. The problem is that there are often lots of layers and resources within an application that deliberately do not cache and lots of resources such as compiled scripts that cache indefinitely. This all leaves a small range for changes in real behavior to effect the metric.
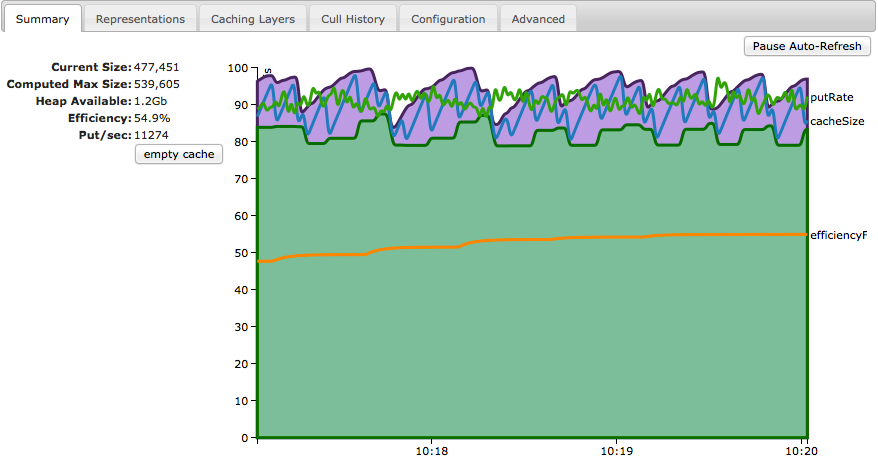
Replacing hit% is efficiency%. In a sentence this figure is: for resources that can be cached what percentage of their cost is retrieved from cache. This means that the dynamic range of this figure can go all the way from nearly zero to one hundred as critical layers of an application can be cached in entirety.
Determination of caching layers
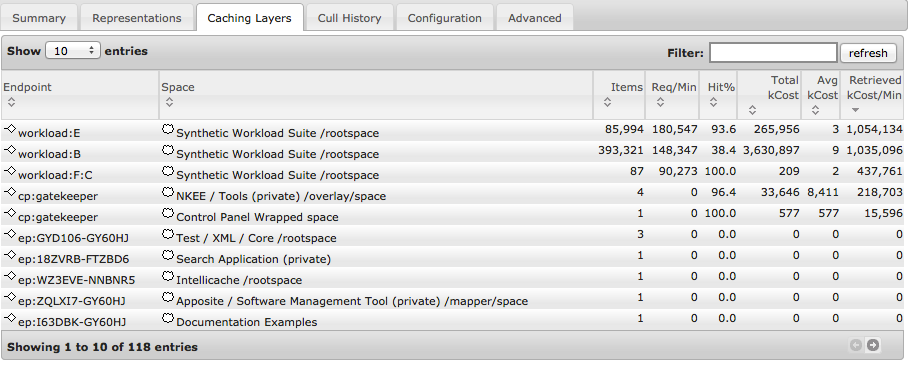
One of the key innovations in the new cache is the ability for it to determine the layers within an application where cache retrievals occur. These layers can be defined as the logical endpoints within spaces which return the representations that get reused. By indexing cache hits against these layers we can not only capture statistics relevant to tuning an application but we can also use these hits to weight the cacheability index of other resources in the same layer. This solves the problem that becomes apparent when working with large datasets, that of the fact that resources may often get culled before getting hit even though ultimately they would have merit being cached. By distributing the cacheability across resources in a layer we are saying “this kind of resource is valuable.” This means much less tuning is needed to get optimal behaviour.
Fast and detailed visualisation tools
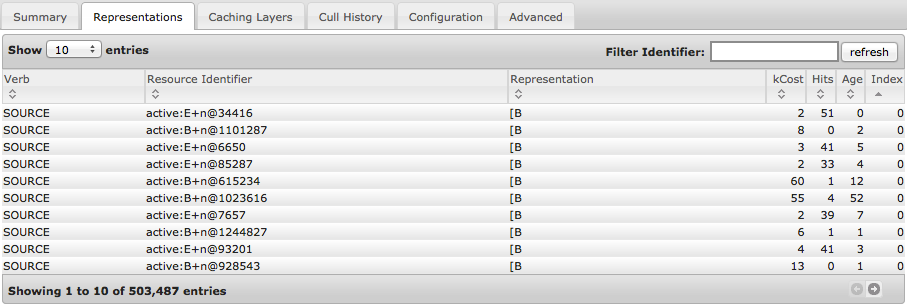
The previous cache used a simple approach to showing what was being cached. It dumped the entire cache contents into an XML document, styled it then served it to the browser. This approach does not scale well to large caches. The new cache has server side sorting and filtering done at a low level for optimal performance. This makes it practical to browser the contents of a large cache.

As mentioned above the new cache also provides a detailed statistical view of the caching layers of an application, again this supports efficient filtering and sorting.

Culling details are also exposed in all their gory detail allowing full transparency into the operation of the cache. This is useful information for fine tuning of a deployment.

Also the cache chart has been upgraded to show more realtime and historical state.

There is still some work to do. Particularly, I want to fully understand how Java GC can be tuned to work optimally with the NetKernel cache. Also I’d like to explore how to visualise the rich data on caching layers within an application. I have an idea that this would look good in the space explorer space structure diagrams.
However the core features are pretty complete and the cache has been given a thorough workout. (I wrote a full declaratively configurable application and stress testing framework to simulate many real world scenarios - I’ll have to go into this in more detail later. It’s something that probably can go into our repositories.)
I’d like to solicit feedback from willing parties on if there are any must have features or issues when used with your real world systems. Get in touch with me if you’d like to get an early preview. Please get in contact with me at tab [at] 1060research.com.