Two weeks ago I spent a couple of days in London attending an Architecture Engineering course at the BCS. Tom Gilb the course creator and teacher along with his son Kai demonstrated the power of an approach to thinking that extends much further than the course title suggests. By seeking to uncover all the variables and risks in any undertaking and then quantifying them, a project can make less subjective decisions through the entire path from conception, requirements gathering, design and implementation of systems. His approach looks like common sense but in his experience and mine, it is not common. In fact often decisions are made my looking for evidence to reinforce an already decided approach even less objectively analysing the pros and cons of competing ideas. Not that this is in anyway malicious, it’s just that good decision making skills are not being taught - even in the best business schools - according to Tom.
This got me thinking. What bold beliefs I/we(1060) hold and claim for NetKernel. I came up with two. The one I want to talk about today is the claim the intrinsic resource oriented caching of NetKernel leads to better system performance and hence for any given system performing a given amount of work the NetKernel solution will use less power.
Today I want to put that belief in the dock. I want to present some alternative systems, perform some objective measurements and let the numbers speak.
So here is what I propose: a simple content serving web app. This app consists of pages of unique content that are composed of three parts. A block of content that is specific to each unique visitor - this corresponds to the account information and maybe personal suggestions. The second part is the main content of the site. For the purposes of this test it is static but takes effort to compose, maybe because it is retrieved from a database and then styled. The third part is a dynamic comments section which periodically is updated with new comments.
In order to evaluate my claims I have three candidate architectures.
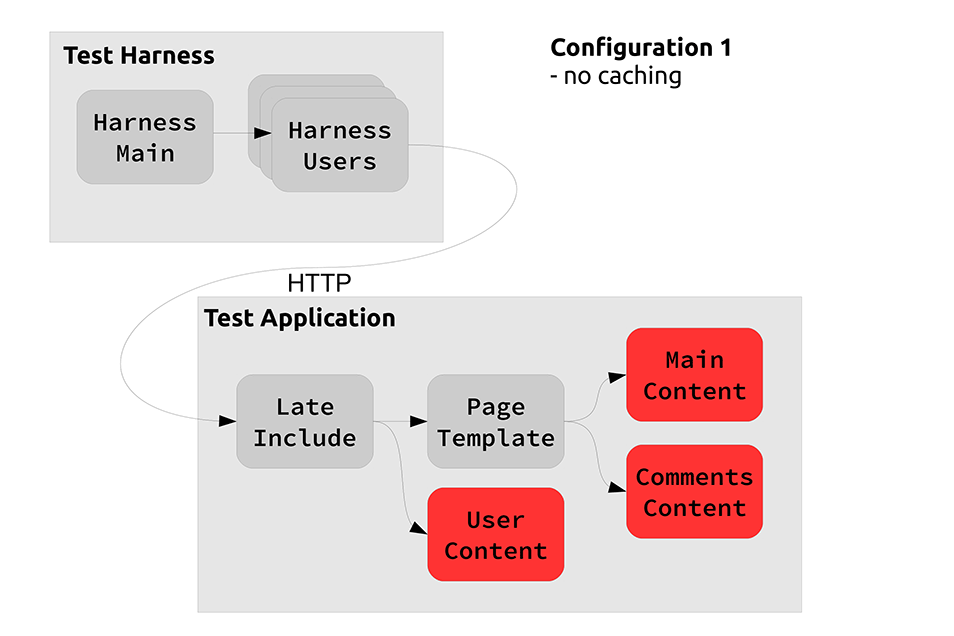
Candidate Architecture 1 The most simple architecture is to aggregate all the necessary content for each page on each request. There is no caching.
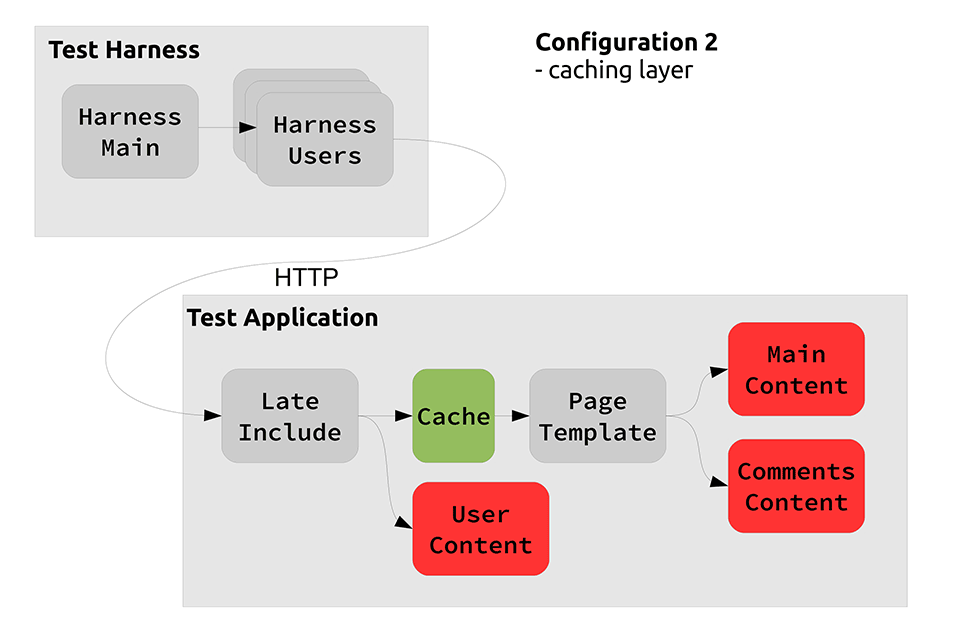
Candidate Architecture 2 A common architecture to improve performance is to put a front side cache on the app. However this must be done before applying the user specific late customisation. This means that we can cache the main content of the site between users.
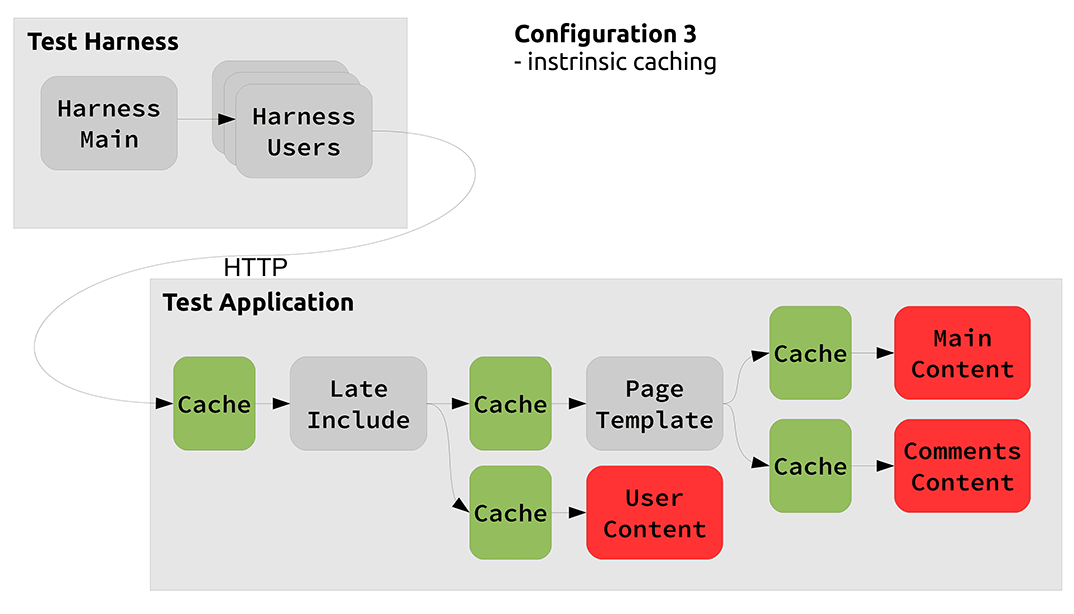
Candidate Architecture 3 This architecture is best practice resource oriented computing. We create data resources for each part of the page and compose them together and let caching just naturally happen. I’ve represented where caching could occur in the diagram with the green boxes, however these are not physically there - caching can occur automatically anywhere. Careful design of the resources ensures that we have identifiers which uniquely identify but which don’t change unnecessarily. For example the user specific content in our app is created as a resource. The identity depends upon the user but not upon the page. We are serving the same content on each page to each specific user.
In addition resources have expiration functions, where necessary, so that they can change when needed. These changes propagate such to cause expiration of any derivative resources. For example, if the comments on a page change the whole page with those comments on will be invalidated for every user.
The Experiment Now we need a test harness that will drive an identical workload to each architecture. I’ve created a multi-threaded client that will act as one user per thread and fire requests for random pages (from a set of 200) periodically to the app. It does this for 96 seconds with requests at a rate of one every 480ms per user with 16 distinct users. I’ve designed the workload so that it is close to maxing out the CPU using candidate architecture 1 (which will be clearly the worst performing.) The reason this modest workload maxes out the CPU is because i’ve put busy loops into into each of the three content generation components of the app to simulate work that would be needed to be done in a real system.
I’m running this test on my Apple Macbook pro which has an Intel Quad Core i7 with hyper threading and an SSD. I’ll be measuring CPU usage and also power consumption. To minimise the baseline power I have turned the display off, unplugged all peripherals and switched to the integrated low-power GPU. I’m measuring power using a wall socket energy monitor that unfortunately only has a resolution of 1 watt.
Results
| CPU Utilisation | Normalised CPU | Power Consumption | Normalised Power | |
|---|---|---|---|---|
| Idle | 2.0% | 0.30% | 7W | 15% |
| Harness Only | 2.1% | 0.32% | 7W | 15% |
| Architecture1 | 650% | 100% | 47w | 100% |
| Architecture2 | 336% | 52% | 37w | 79% |
| Architecture3 | 88% | 14% | 19w | 40% |
I’ve included the operating system “idle” and ran the harness without issuing requests to the app to get an idea of any effect they might be having. We can see the effect is minimal however the baseline of 7 watts is not insignificant to the test. I’m not sure at this stage what is causing that. However I’m guessing that data-center servers have a better baseline without their GPU and with more efficient power supplies.
Now for the interesting part. We see a significant variation in the CPU usage with the ROC approach using 14% of the uncached approach with the simple single tier of caching achieving 52%.
It is unfortunate that power usage doesn’t linearly reflect the CPU utilisation however we can still see that the ROC approach is using 40% of the power of the uncached approach with the single tiered caching using 79% of the power. Things though are potentially better than they seem. In more highly scaled apps we are not looking at how utilised a single server is but how many servers we need to provide the necessary compute power. In this situation the power usage is linearly proportional to the number of servers required.
I’m made the NetKernel module that contains both the test app and harness available here.
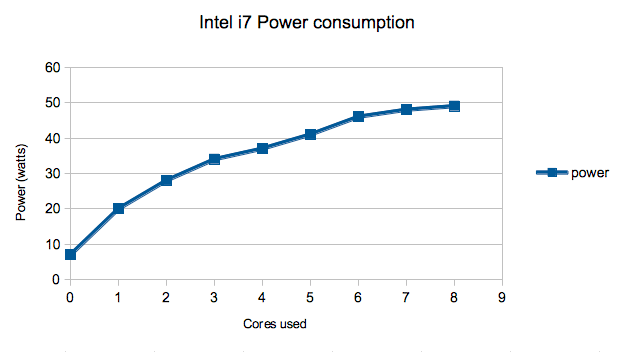
Understanding the linearity of power consumption with CPU utilisation Here is a graph of power usage against CPU usage for the Intel i7. You can see that not only is there an offset of 7w but also it is non-linear with increasing usage showing reduced benefit.
Here is some raw data I captured using a couple of ARM architectures: 1. Rikomagic MK 802 III LE, Dual-core Cortex-A9 processor (ARMv7 architecture) clocked at 1.6 GHz 2. Raspberry PI Model B, Single core ARM11 (ARMv6k) clocked 700Mhz
I have some better resolution power measurements here due to an energy measurement board kindly provided by the Mageec project and an instrumented USB power cable. The advantage of this board for me is it can be setup to capture results millions(!) of times a second and average out. This leads to a very accurate measurement. Incidentally the reason why the board measures power so fast is that it is designed for measuring down to the granularity of CPU instructions and lines of code executing to give real feedback on the optimisations that a compiler can make - this is the aim of the Mageec project.
| Rikomagic | Raspberry PI | |
|---|---|---|
| 0 cores | 0.052W | 0.136W |
| 1 core | 0.158W | 0.177W |
| 2 cores | 0.220W | n/a |
What is immediately apparent here is the tiny amount of power consumed by these platforms. In the following table I show the NKMark (a measure of how well the platform runs NetKernel and available in the Apposite repository on an installed NetKernel instance) against their peak power usage and the NKMark/watt figure which shows how efficient they are. Clearly the ARM architecture doesn’t have the raw power per core yet but with 12 times more compute power per watt it’s obvious why there are becoming an interesting proposition.
| Peak Power | NKMark | NKMark/watt | NKMark/core | |
|---|---|---|---|---|
| Intel i7 | 49W | 45.8 | 1.35 | 5.7 |
| Rikomagic | 0.22W | 3.6 | 16.4 | 1.8 |
| Raspberry PI | 0.177W | 0.2 | 1.13 | 0.2 |
Understanding the caching achieved with ROC We have the headline figure now of how much power is used by the ROC solution and CPU utilisation. Using the cache viewer tool built into the NetKernel distribution we can see some statistics on how the caching is helping us achieve better performance.
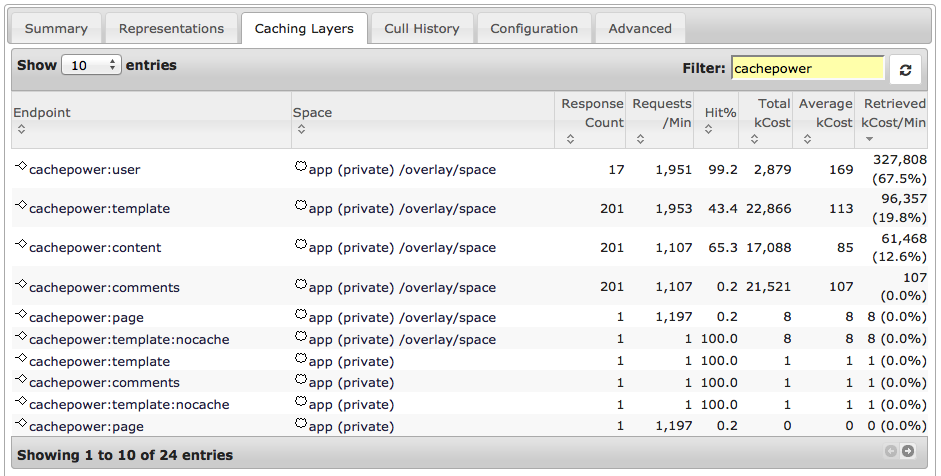
The endpoint column on the left contains endpoints in our application whose responses are cached - this is effectively the locations within the architecture. We can see the number of responses cached, how many requests are received and the cache hit rate. kCost is a measure of the computation that went into producing the response. NetKernel measures this by accumulating CPU time. Retrieved cost per minute is the most meaningful figure of merit as it shows just how effective caching at that point in the architecture is.
Here we can see how caching of the user specific part (cachepower:user) of the page has a big payback. We get a massive cache hit percentage because of the limited number of users in our test scenario. Additionally we see the generated content (cachepower:template) caching well. This is the layer that we set to explicitly cache in Candidate Architecture 2. But then we see additional caching of the main content part of the page (cachepower:content) this is because this this remains valid even when the comments change.
In addition to these caching locations that I wanted to make explicit for the purposes of this comparision there is additional caching going on. This isn’t hidden, I just filtered to only see the cachepower specific endpoints. We can see this by digging deeper with the tools.
Firstly all the endpoints in this system are implemented in groovy script. This is dynamically compiled to bytecode from the source code within the module. This is held in cache whilst the file remains unchanged. Secondly the page content is generated as XML and internal representations are all DOM. These DOM object models can be cached. However when caching occurs at the edges of the system, where the binary stream is served over the network, the serialised form of the XML is cached. This saves the work of re-serialising every time.
Tools like this give great insight into the operation of complex systems - if you can’t measure it, you can’t manage it!