We’ve been working recently with a client, on a solution, revolving around crunching large volumes of data. The scale of data meant that even on a large cluster the computation takes many hours. The usual mode of operation for these compute jobs is to set them off in the evening, and return the next working day to see the results. I was working with them to capture some engineering figures and statistics to assess the performance and opportunities to optimise or re-design. It was in this work that I realised that many of the tools we provide in the NetKernel Management Console are design to work realtime, and that by the next morning their value was reduced.
One of our core guiding principles in NetKernel is that as much of the inner workings and state is exposed as possible. We learned this early by observing users with a partial mental model of resource oriented (ROC) abstraction making guesses about what was happening, or more often what was not happening as expected. As such it is very valuable to have a live NetKernel instance with access to the introspection tools not just whilst developing, but also in testing and production environments to varying degrees.
These introspection tools also provide valuable insight during a tuning or evaluation cycle; an evaluation cycle you say? - a process whereby you assess a system not just by hard, pass-fail criteria about it meeting requirements, but by looking for non-intuitive consequences of your decisions, or inklings of future troubles. I realise that an evaluation cycle isn’t a key part of many fashionable development methodologies, such as test driven development, or agile. Evaluation by just the metrics of meeting requirements, and cost, neglect the consequences of technical debt leading to short-termism and sub-optimal outcomes.
The point of this post, however, is that following these principles has lead to the development of a new tool. A tool which allows statistical insight into the past operation of ROC systems in new ways. One tool that has proved very valuable is the endpoint profiler. It captures a statistical profile of all endpoints executed over a period of time, including number of requests processed, number of exceptions raised, average, and cumulative time.
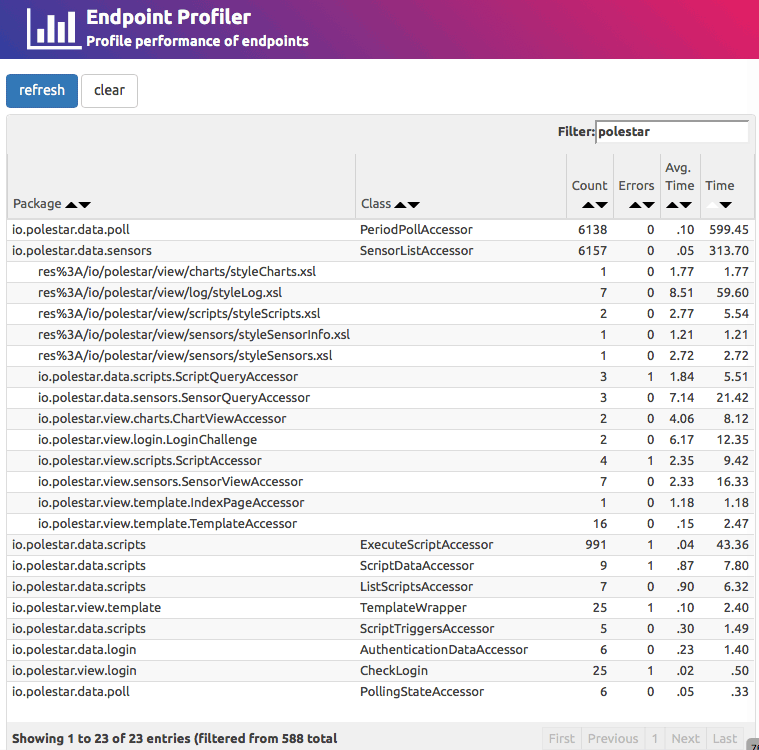
The endpoint profiler is great for not only finding performance hotspots within a system, but also in piecing together a picture of what happened - things like number of different types of requests that were executed, and how much caching occurred. It gives a good summary of what has happened inside the system. What it isn’t so good at is getting an external view of how requests were processed. That is where the External Request Profiler comes in.
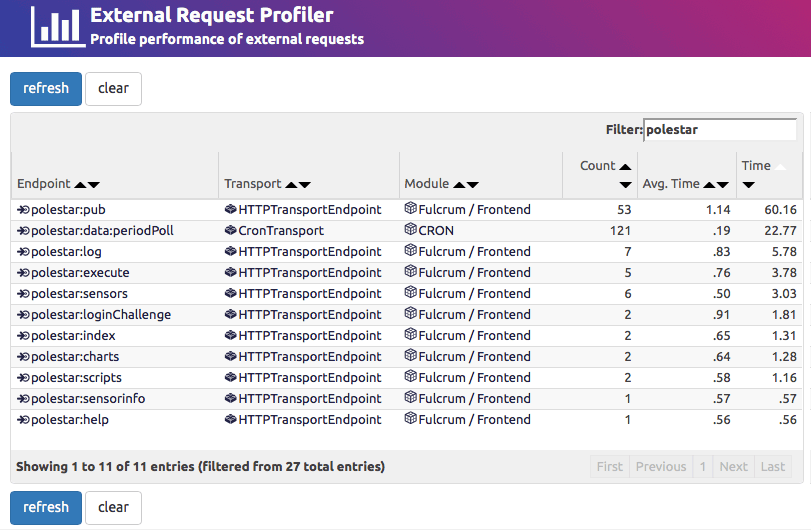
Here we get a breakdown, keyed by origin transport and resolved internal endpoint, of the request counts with average elapsed and cumulative time. The combination of the two tools - endpoint profiler and external request profiler - provide a statistical view somewhat similar to the visualiser, but without the memory requirements. In fact both profilers run with insignificant effects on both execution speed and memory overhead.